
Execution quality
Are the right decisions being taken?
Measures the share of actions and decisions matching the steps expected in the scenario.
Soriston turns every training session into useful data for understanding your learners’ choices, mistakes and progress. Quickly spot what needs reinforcing.
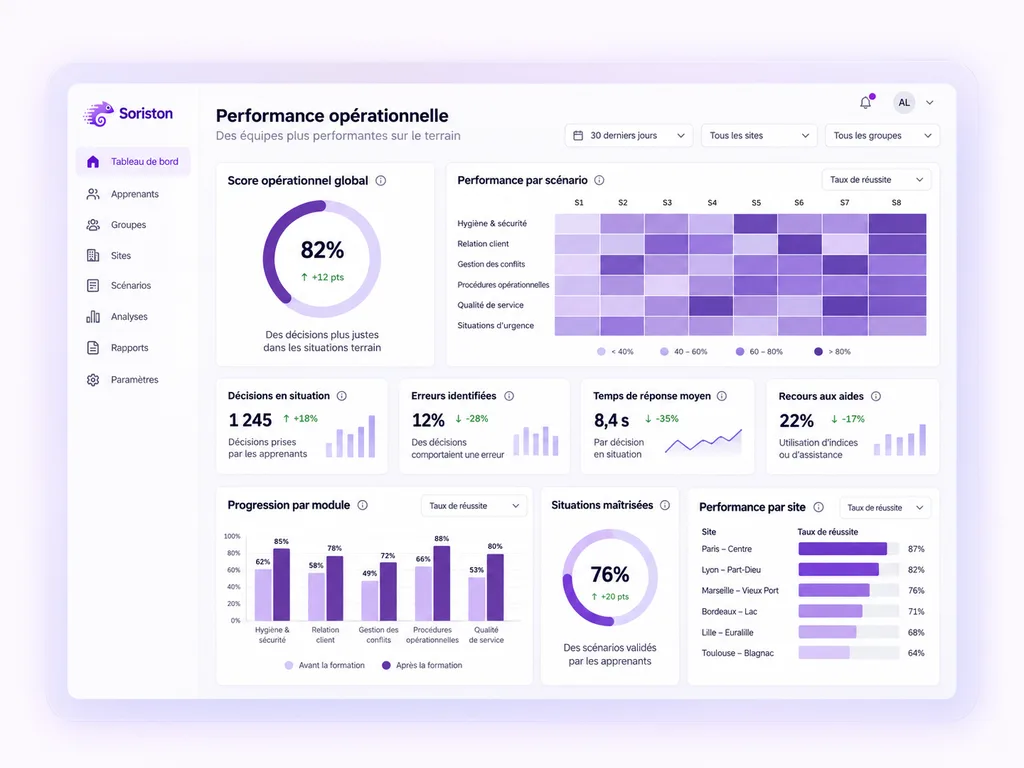
Every interaction leaves a usable trace. Soriston records the decision taken, the response time, the elements consulted before acting, any use of help, and whether the situation was passed immediately or after a correction.
Each one answers a concrete question about learners’ level, autonomy and progress
Are the right decisions being taken?
Measures the share of actions and decisions matching the steps expected in the scenario.
Which errors need correcting first?
Identifies the errors defined as critical in the scenario and highlights the situations that need reinforcing.
Does the learner succeed unaided?
Measures the use of hints, help or guidance offered during training.
Is the situation passed on the first try?
Separates immediate success from success obtained after an error, a correction or another attempt.
Is performance improving with training?
Compares the same learner’s results across sessions to show how they evolve.
Which exercises are now validated?
Shows the scenarios reaching the defined pass level, by learner, group, site or topic.
Each profile sees the information relevant to their role, from the individual result to the organisation-wide view.
They identify the successes, the difficulties and the situations that need more practice.
They see the results of their teams or cohorts and spot recurring difficulties.
They compare results by group, site, region, role or module and follow how they change over time.
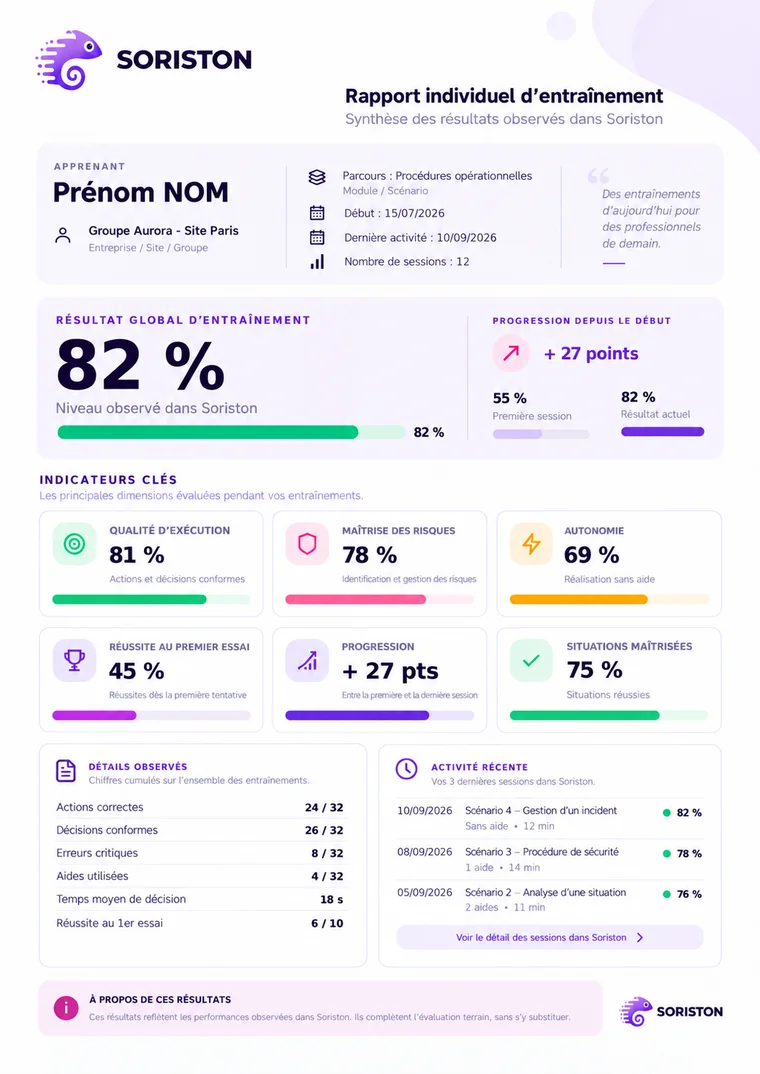
For each learner, Soriston brings together the main results and how they have progressed in a summary that can be read in a few seconds. The trainer or manager can quickly identify the successes, the difficulties and the points to work on again.
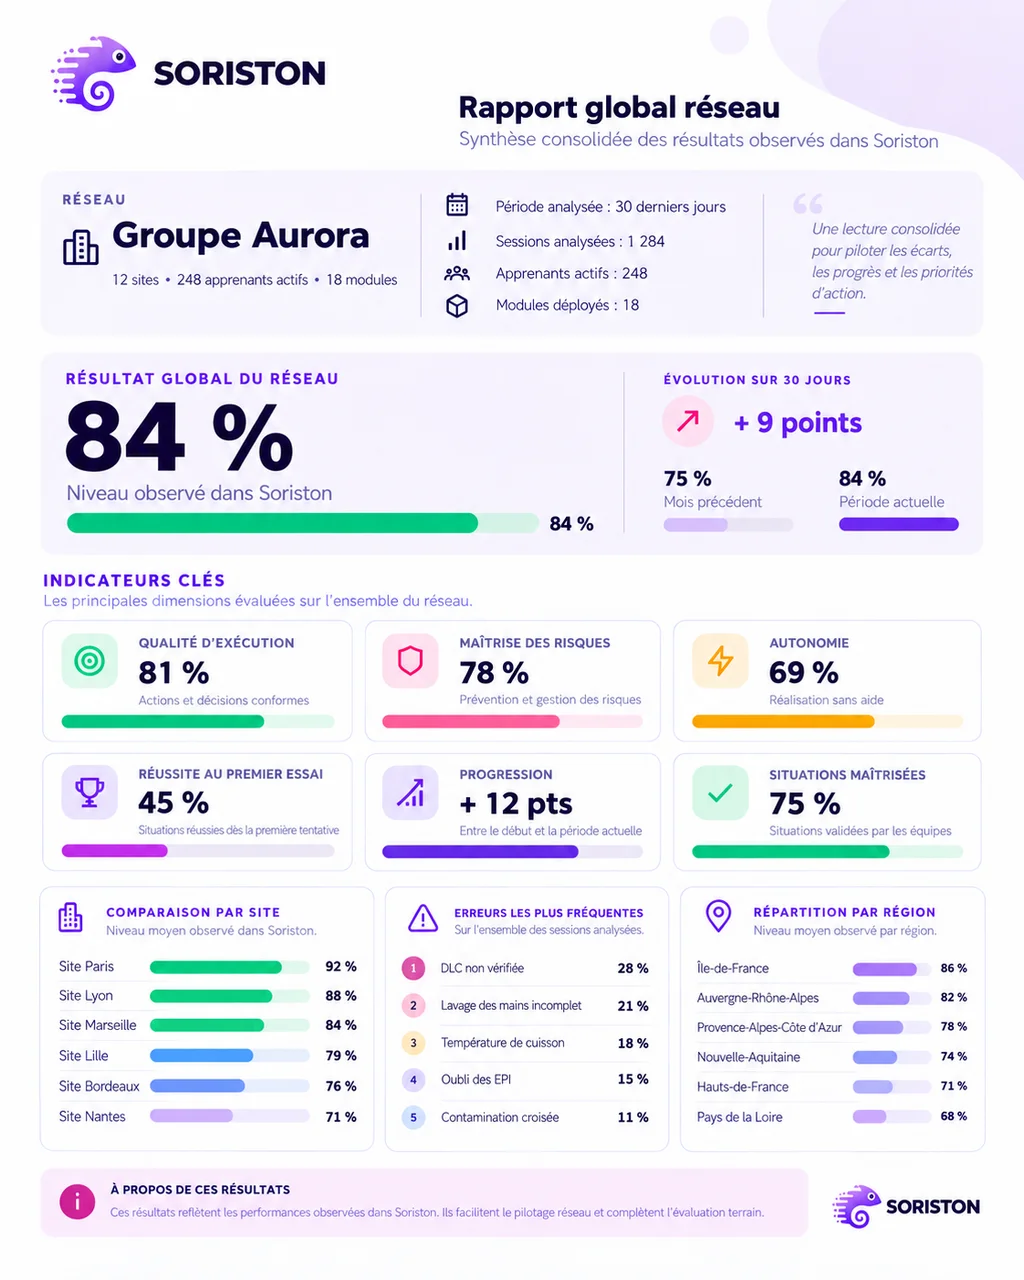
Bring your learners’ results together in one dashboard and compare them by group, site, region, role or module. Identify recurring difficulties, follow progress and quickly spot what needs more training.
The results observed in Soriston are personal data. They are hosted in the European Union and processed within a GDPR-compliant framework.
Your organisation remains the data controller. Pixeo Group, the publisher of Soriston, acts as processor. This data primarily supports training follow-up, assessment of what has been learned in Soriston and the management of training.
Detailed results are mainly intended for trainers, managers and administrators, according to the rights they hold. Learners can receive quick feedback at the end of their training, but Soriston is not designed as a space where they permanently consult a full dashboard of their performance.
No. Individual feedback stays specific to each learner. Team, site and network views are reserved for profiles holding the matching rights.
No. Soriston measures the actions, decisions and results observed during training carried out inside the platform. That data helps identify progress and what needs reinforcing, but it does not on its own replace assessment in a real situation.
Yes. Depending on the rights granted, results can be consulted at different levels in order to compare groups, sites, modules or periods and identify recurring difficulties.
Yes. Authorised managers can download results as a PDF report, to keep them, share them internally or add them to their training records.
Results are stored locally during the offline session, then synchronised with the platform when the device regains a connection.
The retention period depends on the contractual framework and the applicable processing policy. Detailed terms are set out in our privacy policy and in the contract documents.
Integrations with an LMS, SSO, an API or other systems can be studied depending on the project and the company’s technical environment.
15 minutes to understand your context and your challenges, and see whether Soriston can genuinely help you.
About 15 min · No commitment · Nothing to install